Read linear results
Pieces, yield, waste, cost and the cut diagram for each bar.
Available onFree toolsProBusinessTeam
Updated September 27, 2026Browse all help topics
The summary
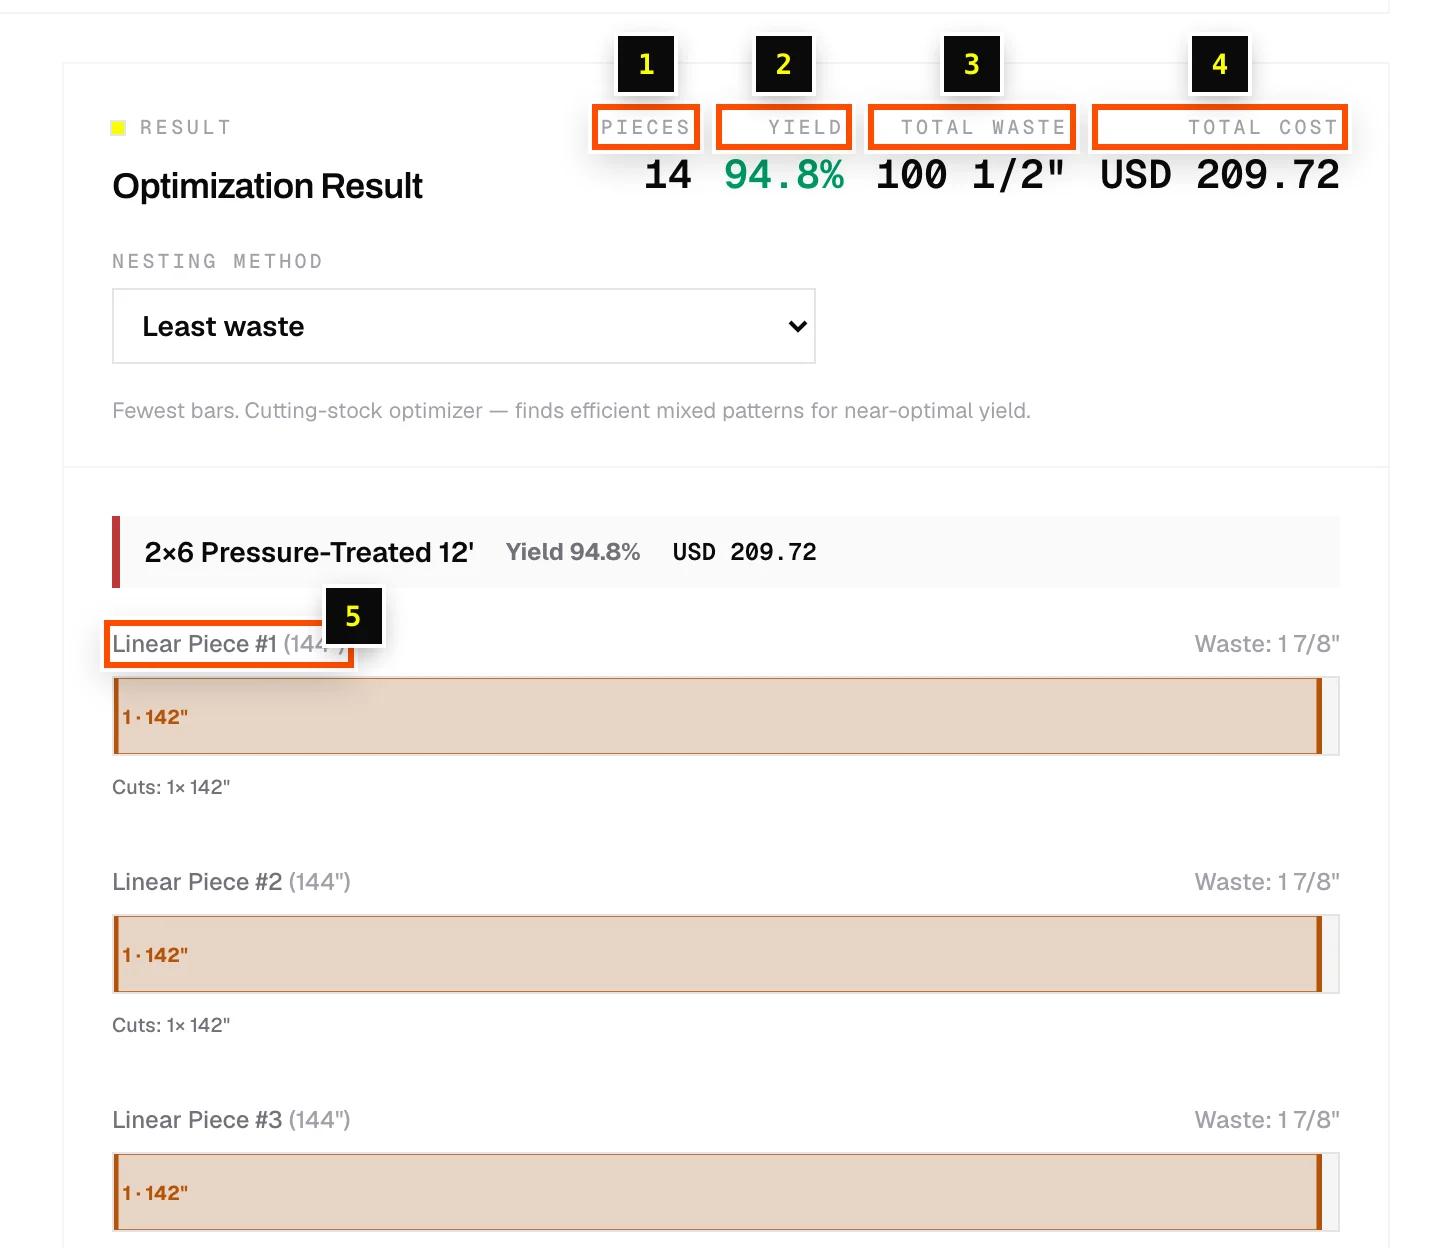
- Step 1: Pieces: how many sticks of stock you need. With cross-section cuts on, you'll also see the number of ripped sticks (cuts).
- Step 2: Yield: the share of stock length that ends up as parts.
- Step 3: Total waste: offcuts plus kerf, in your display units.
- Step 4: Total cost: the cost of the stock used (when Prices is on).
- Step 5: The cut diagram for each bar. With the Paint chip on, a Paint figure shows gallons, painted area and coats.
Bar diagrams
Each bar (Linear Piece #1, #2, …) shows its cuts in order, with the waste at the end. Hover a cut to see the part name and length. Parts longer than the stock are split and labeled (joint 1/2), (joint 2/2). See Parts bigger than your stock.
Related articles
Didn't find what you need?
Email us and tell us which article you were reading.